Big news…

18 03 2008

There is a big announcement today at Widemile and a new post by me. However you won’t see it here. Please head to http://testingblog.widemile.com to see the new site! To celebrate Widemile’s annoucement, I have moved to a widemile.com domain and have a new design.

If you subscribe to my feedburner RSS feed, I have automatically changed it to the new site, however if you use the wordpress.com RSS feed, you will continue getting this site’s feed which is now dead. Please update your feed to http://feeds.feedburner.com/billyblogwm.

I will no longer be updating this site, other than to point people to the new page. So please head there now!

New URL testingblog.widemile.com


3 posts on 3 topics

6 03 2008

Edit: I fixed all the links in this post.  Copy and pasting is getting the best of me!

I recently came across a few great posts that I enjoyed and wanted to pass onto you all. The first is from Tim Ash, who has written a great book on Landing Page Optimization. One of his more recent entries discusses how to write effective copy to increase conversions.

One of my favorite bloggers, Avinash Kaushik tells marketers to embarrass their managers in order to succeed at their campaigns. Testing tops that list of course, but his other techniques are great methods at “working the system.”

Lastly, Lenny de Rooy, wrote a guest post at SEO Scoop about 5 misconceptions of Google Web Optimizer. It goes slightly beyond just GWO itself and into testing methodology


How to get ideal test conditions (and results)

4 03 2008

A big mistake in testing is to overlook variables inside and outside of the test that impact results. In an ideal test, the only variables would be the ones you are testing on your page. That usually isn’t possible though, but as long as you account for them in your analysis, you will get correct and actionable information.

Sky image

If you test a seasonal page, then the optimal page you get for that season, probably won’t perform when the season ends. By not paying attention to those kind of variables, you are setting yourself up into thinking you’ve found the optimal page. The same type of mistake is made by grouping e-mail, print, SEM campaigns and event traffic, unless you know they react the same to your changes.

Even within segments, there might be more segments to uncover. Your only limitation should be traffic; don’t segment so granular that you can’t run a decent sized test in a decent amount of time.

One of my clients doesn’t get a lot of traffic, but the traffic he does get is very distinct. One converts in the single digits and the other converts in the teens. Although combining them would get me more data, it would be very confused data since they convert so differently.

A few things to look out for:

  • The ad or offers visitors see beforehand
  • Interactions between your factors (if you aren’t testing interactions)
  • Technical problems
  • Problems that occur before or after the tested page

A note about the last bullet, the problems can range from a technical problem to a problem with the overall funnel. If people get different experiences in the funnel that drastically impact whether they convert or not, it can add a noise to your test. Some examples are different checkout processes for registered and non-registered users or users being inelligible for service.

The purpose of testing is to find out if a certain element performs well under the conditions you provide. If you aren’t paying attention to all the conditions, then the results you derive will be incorrect without you knowing.


3 steps to quickly make a good multivariate test

21 02 2008

Having great testing technology puts a lot of power in your hands. You can test anything and everything you want. However, like any other tool, to use it effectively you have to use it right. There’s a lot of best practices and thought that goes into test design, but following these three rules can get you a good test in most situations.

Steps
  1. Maximize your traffic: Pack as much as you can into a test for the amount of traffic you have to keep it a short test. Using Widemile’s platform that’s 2 weeks to be safe, with Google Optimizer you should do at least a month (explanation).
  2. Test opposites: If you test stuff that’s similar, they’ll perform about the same. So find out the general theme you should be following first by testing opposites (B2B vs B2C, podcast vs ebook, descriptive vs benefits).
  3. Learn from the previous test: Always make sure you line up your tests so that you learn something that can be used in the next one to either refine or to learn something new.

The goal of these three things are to maximize your time spent testing by testing as much as possible while also minimizing testing suboptimal content. For example, if I was selling iPods and I tested 2 images of people running with the iPod, one with a man and the other a woman, I might think that was a good test. However I could have totally missed out on an image that worked better, such as an iPod next to a PC. I could test that out after the initial test, but then I just wasted one test run. The right way would be to test one sport image versus one PC image and find out which direction to go. From there I could test against other opposing images or refine the PC image.

The only warning I’d throw in is that if you’re trying to test a lot of things at once, you might want to scale back. Pick a 2-4 themes depending on your test size and stick to testing them out. Don’t mix and match.

Follow these steps and you’re on your way to getting not quick tests, but efficient ones.


What is Taguchi? How does it relate to testing?

14 02 2008
New URL testingblog.widemile.com
the Taguchi method

Multivariate testing is a buzz word these days, but the buzzword of multivariate testing seems to be Taguchi. However, that term is being abused. Do you know what Taguchi really means? I wasn’t even positive, so to get some background, I did some research and talked with Vladimir (Widemile’s Chief Scientist).

The name and method comes from Genichi Taguchi. His method, also known as Robust Design, attempted to improve product manufacturing quality. Therefore it falls into an area of engineering called Quality Engineering.

Does this sound aligned with website testing? Not really, and this is the problem of using the term Taguchi with web site testing. The goals of manufacturing and the goals of a website are not the same.

What most people are attempting to grasp when using the term Taguchi is fractional factorial test design. (I discussed this at length in my post about the difference between Widemile’s technology and Google Optimizer.) The Taguchi method uses a fractional factorial test design and is under the umbrella of fractional factorial testing but is not the only or best fractional factorial method. In fact, even within manufacturing, the Taguchi method was the inspiration for many new techniques but many statisticians find it flawed.*

It is important to differentiate the Taguchi method from fractional factorial test design since one is a basis for manufacturing while the other is purely related to design of experiments. You need to ensure that the math and science behind your testing is based on methods that have the end goal of optimizing your website only. So if your testing tool uses the Taguchi method for testing, you better ask what that really means.

So does Widemile use Taguchi? We don’t use the Taguchi method, however do use fractional factorial test design. I like to say that our platform goes beyond Taguchi because it was specifically made for optimizing web content.

Don’t get sucked into the Taguchi method, it is just a buzzword used by your fellow marketers. Just because the technology doesn’t use Taguchi, doesn’t mean you should count it out.

*Read more after the jump for Vladimir’s explanation of the Taguchi method and its criticisms
Read the rest of this entry »


3 ways to maximize PPC and Landing Page Optimization

7 02 2008

New URL testingblog.widemile.com

Quality PPC and LPO campaigns are key to great conversion rates. If either of them are optimized, you might get good results, but with both of them optimized, your gains are exponential. There are a few pitfalls in optimizing them both though, even with good intentions you may end up confusing your results rather than getting results.

PPC and Landing Page Optimization

Here are 3 methods to effectively optimize your PPC and landing pages:

  1. Do one at a time: Test out your new PPC strategy, but wait until your landing page testing is done. Changing your PPC means you’re changing the audience, both in demographics and expectations. This will impact your landing page testing. Once you find a winning PPC campaign, test the same messaging on your landing page. This is the easiest way to optimize both, but the next two are better ways to go.
  2. Do them simultaneously: If you are testing 2 PPC strategies, create 2 separate landing page tests to match the respective campaigns and drive traffic solely to the matching test. This avoids biasing the PPC that better matches your landing page.
  3. Segment all the way through: For segments you know you’re going to have, make them go to different landing pages. Test your pages and separately track how each segment performs. Sometimes all your segments respond best to the same landing page, but often times your segments want something different and it’ll show in your testing results. Also, if you’re doing #2 and realize that the ROI is good enough for both campaigns, break it out and optimize them separately.

These are basic, but very effective methods to maximize testing both your PPC and landing pages. If you want to get actual and sustainable results, you have to control as many variables as possible. Only when you can trust your data, will it perform how you expect. Follow any of these methods and you’ll be on your way to higher conversions.


Multivariate testing: Let customer actions tell you what’s right

5 02 2008

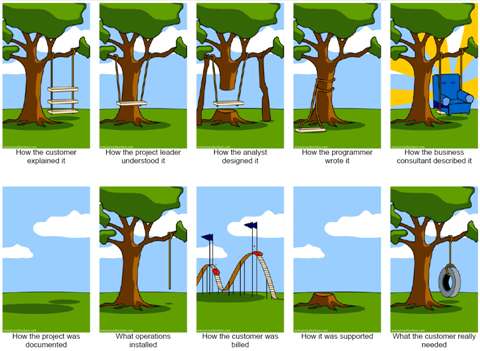
This comic is both hilarious and insightful. Take a second and see if you’ve experienced something similar to this situation:

customerneedscomicthumb.jpg

I came across this before starting my work at Widemile, but stumbled upon it again while browsing Marianina’s Web Analytics Princess blog. Surprisingly, I found it extremely relevant to the multivariate testing I do at Widemile now.

The comic is a joke about how hard it is to do what customers want. Even when you have the luxury of a customer telling you everything they want, they don’t always do it correctly and no two people interpret their instructions the same. I like this comic because it shows how difficult it is to create good experiences and products for customers, no matter the amount of help you have.

Now, imagine how this applies to your website. Visitors want your product presented to them in a certain way with certain offers. Before testing, you’d listen to visitors with analytics, surveys and usability studies even. From here everyone would make their own “panel” of the comic; the creative team would have a go, the marketing team would revise it and the CEO would change a few words around. Eventually a page is made and your business puts it online, not knowing whether the page is what your visitors truly want.

Take that same situation and add multivariate testing. Now we get the same perspective that we have when looking at the full comic strip. In the previous situation, all you could see was your individual panel and your customers could only choose the one you gave them. With a multivariate test, different customers see different versions and the trends that show up in your data, reveal the “whole comic” and point you to which one should be the last panel… what the customer really needs.

If you look at the first panel and the last panel, it’s immediately obvious that they are different. Your customers can tell what they like, even if they can’t articulate it. Start listening to their true feelings by testing your pages.

For more of these comics, check out the official Project Cartoon site.


What’s an average conversion rate? 40%!

1 02 2008

New URL testingblog.widemile.com

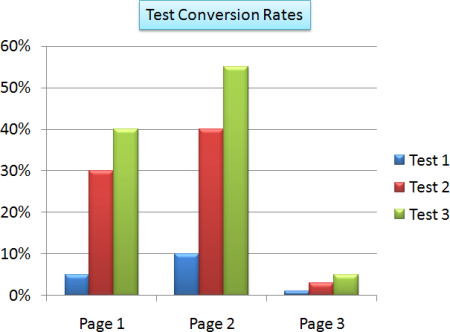
Would you believe that? And if it were true, would it really mean anything to you? It shouldn’t.

Conversion Rate Table

I get asked this question fairly often and at first glance it seems like a logical question to ask, but really the focus should be elsewhere.

From my experience, conversion rates range from less than a percent all the way up to 30% or more. Does knowing that help me optimize my clients’ pages? No. Every page has so many variables internally and externally that it is very difficult and nonsensical to worry about the average conversion rate.

The goal of your page, differences between your product/service against your competition, target you’re trying to reach, avenues you advertise and numerous other factors all effect your conversion rates. A competitor having a higher conversion rate than you, does not mean you’re doing something wrong. Set the baseline for yourself and keep improving it. That’s how marketers should approach their conversion rate.

If you’re testing, you’ll find out if you’re campaign is performing suboptimal and find out what the optimal is at the same time.

Pretty amazing huh?

I don’t tell clients I’m going to get their conversion rates above industry averages, I tell them that I’m going to make their campaign as successful as possible. Do that and you’ll be ahead of competition and ahead of where you were when you first started.


Get Certified in Landing Page Optimization

30 01 2008

After 4 months, I finally received certification via the *breath in* Marketing Experiments Certification Course on Landing Page Optimization – Subscription Path Track.

Marketing Experiments Logo

If you already follow Marketing Experiments, much of the material they put out for free is discussed in the class (although in greater depth.) Flint McClaughlin, who runs Marketing Experiments, knows testing and optimization very well, but the class could be stronger. Taking the class, training at Widemile and working with clients simultaneously has taught me a lot, very quickly, so as the class went on, I wasn’t learning as much. Those of you who don’t have the benefit of being surrounded by testing pros, probably will get a lot more out of it.

In addition, sometimes the number of conversions for their case studies are quite low, which leads me to question some of the testing numbers. I’m sure they got lifts, but their numbers are a little outrageous at times and, as my boss Frans brings up, seem to not account for seasonality.

Despite all that, I’d definitely recommend it to anyone who wants to get into or needs to learn how to make better landing pages. They offer many other certification classes and while I can’t really say how good the other classes are, I have a strong feeling that they are worthwhile too.

Regardless if you do or don’t want to take the class, you should take the time to learn their conversion index formula. It’s the overarching idea of the class and really helps you think in a systematic way about what should be improved on your pages and funnels. The conversion index formula is:

Marketing Experiments Conversion Index

C is the probability of conversion, so this formula deals with variables that cause visitors to convert or not convert. Here’s the quick rundown of each letter:

  • m – motivation of the visitor
  • v – your value proposition
  • i – incentive to convert
  • f – friction of the process
  • a – anxiety about converting

I don’t want to go into too much depth, but I will mention that my favorites are incentive and friction. They are together in the equation because they counteract each other. You use incentives to overcome the friction of the page. So offering your visitors a white paper helps them deal with giving up their name and e-mail address to you. Visitors know they are going to get a call or e-mail when they give you info, but you have to give them reasons to give it to you.

An example of this that most of you have probably experienced as an internet user is when you find a great deal on a badly designed website. Even if it’s tough to get through the checkout process (friction), you’re likely to finish it since it is a great deal (incentive).

One of things I’ve learned is that making website changes is rarely a streamlined and easy process. The best situation would obviously be to have good incentives and low friction, but you can’t always improve everything because of office politics, technical reasons, lack of resources or numerous other things. So by using this formula and keeping these things in mind, you have multiple ways to attack problems either offensively (increase incentives, value proposition, focus on user motivation) or defensively (decrease friction and anxiety).


Google Optimizer is slow (or Not all Multivariate Testing is the same)

28 01 2008

New URL testingblog.widemile.com

Without knowing it, people might assume that there’s only one method to multivariate testing. That it has been long figured out by math and statistic wizards. I have learned otherwise from Widemile’s personal math wizard, Chief Scientist, Vladimir Brayman.

(Just as a side note, he does not have a typical office. Rather than papers and folders strewn about, he has statistic and math books. Lucky for me though, he has a great skill at distilling all the goodness in those books and teaching me what I need to know, in a way I understand.)

Most recently, we discussed why Widemile’s technology trumps Google Optimizer.

Widemile vs Google


Having a strong creative team and testing experts ensures better results than giving a marketer a tool like Google Optimizer, that’s easy for most people to understand. But explaining how Widemile’s technology can test more, faster, is a little more complicated.

Let’s explore how Google’s testing works versus Widemile’s. Google Optimizer uses full factorial test design, meaning it creates a page for every combination of your tested page elements. So if you wanted to test 4 different hero shots, 4 buttons and 4 headlines, that would require 4*4*4=64 page combinations. The disadvantage of this method is that you need significant traffic for each of the 64 pages. Meaning you either need a lot of traffic or a lot of time; for most companies, they’ll need both.

To solve this, Widemile’s optimization platform use fractional factorial test design. This method tests only a small fraction of the total possible page combinations and uses statistical analysis to derive almost all of the same information that would be found in a full factorial test. This works because marginal information is gained in testing all 64 page combinations, while testing a few important combinations tell us nearly everything we need to know.

Google actually criticizes fractional factorial test design (look here where it says “A note about ‘fractional factorial testing'”), saying that it requires the same number of impressions, but can not derive the depth of conclusions that a full factorial design can. While true that full factorial squeezes out the most information, that is at a sacrifice of extending the test many times longer than with a fractional factorial test, all to learn the smallest influences.

Doing successive tests to find high influence items with fractional factorial testing will get much higher gains than getting every ounce of information out of one extremely long full factorial test. In addition, with a carefully designed fractional factorial test you can learn all the major influences and the interactions between elements on the page.

Fractional factorial test design gets you a completed test in weeks rather than months or years even, and because of that, you can test more than you would normally be able to in the same time frame. You can either test more in one larger test, or do many smaller successive tests.

Not to say that Google Optimizer isn’t a great tool, especially since it is free, but any company that spends thousands of dollars on SEM has a lot to gain by using technology that gets rapid results.

If you got any questions about this, let me know and I’ll try to answer them or get you an answer.